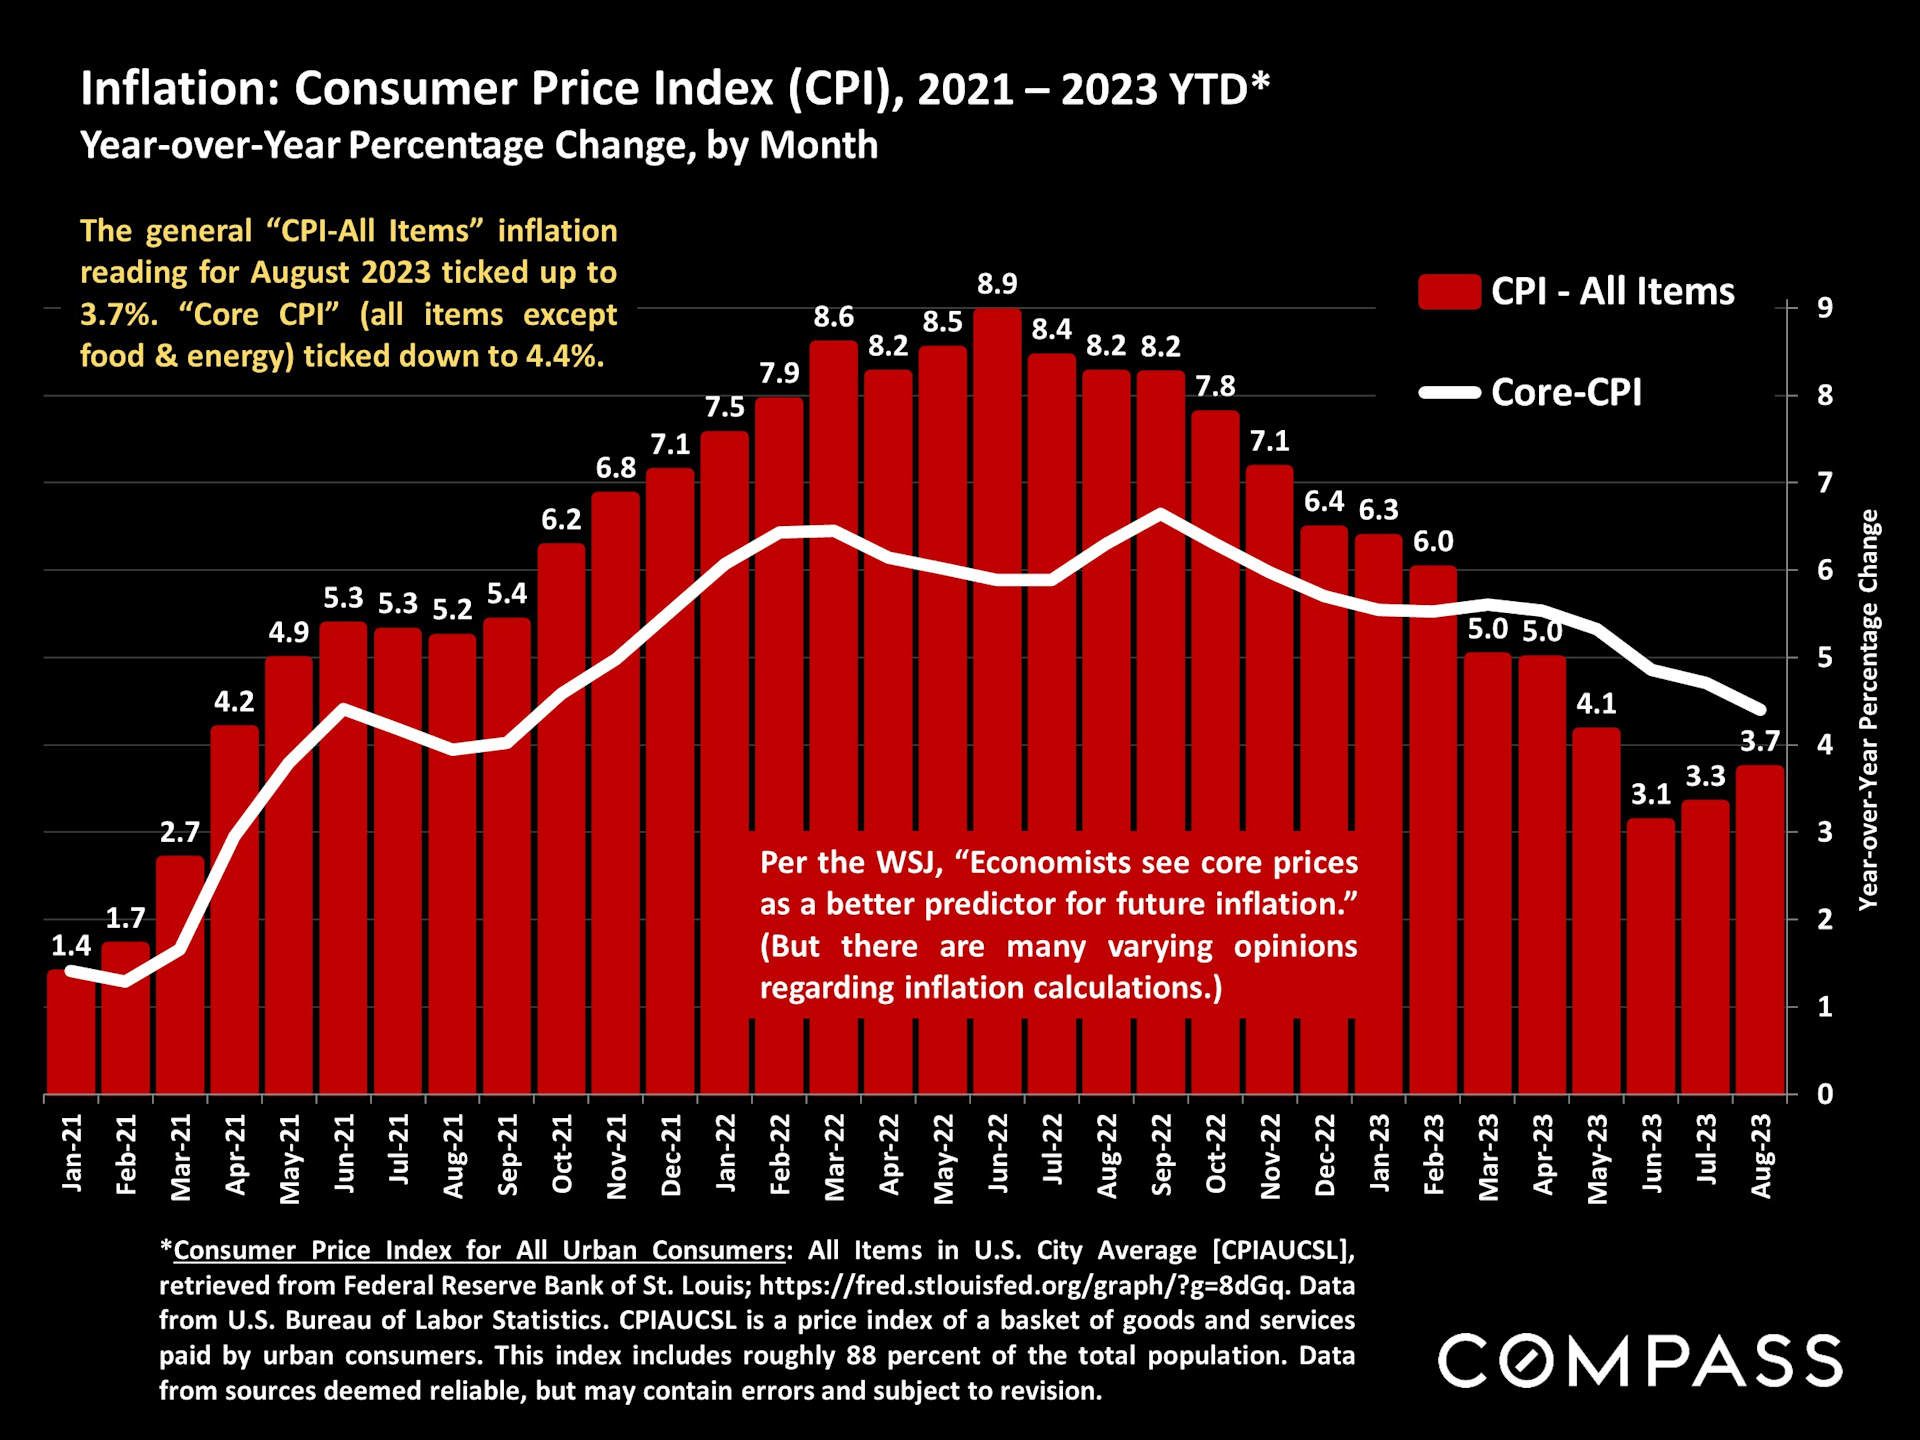
The new inflation report for August was released yesterday, with the general CPI reading ticking up,
and the Core-CPI reading ticking down. Neither bond markets nor stock markets have, so far, responded dramatically.
and the Core-CPI reading ticking down. Neither bond markets nor stock markets have, so far, responded dramatically.
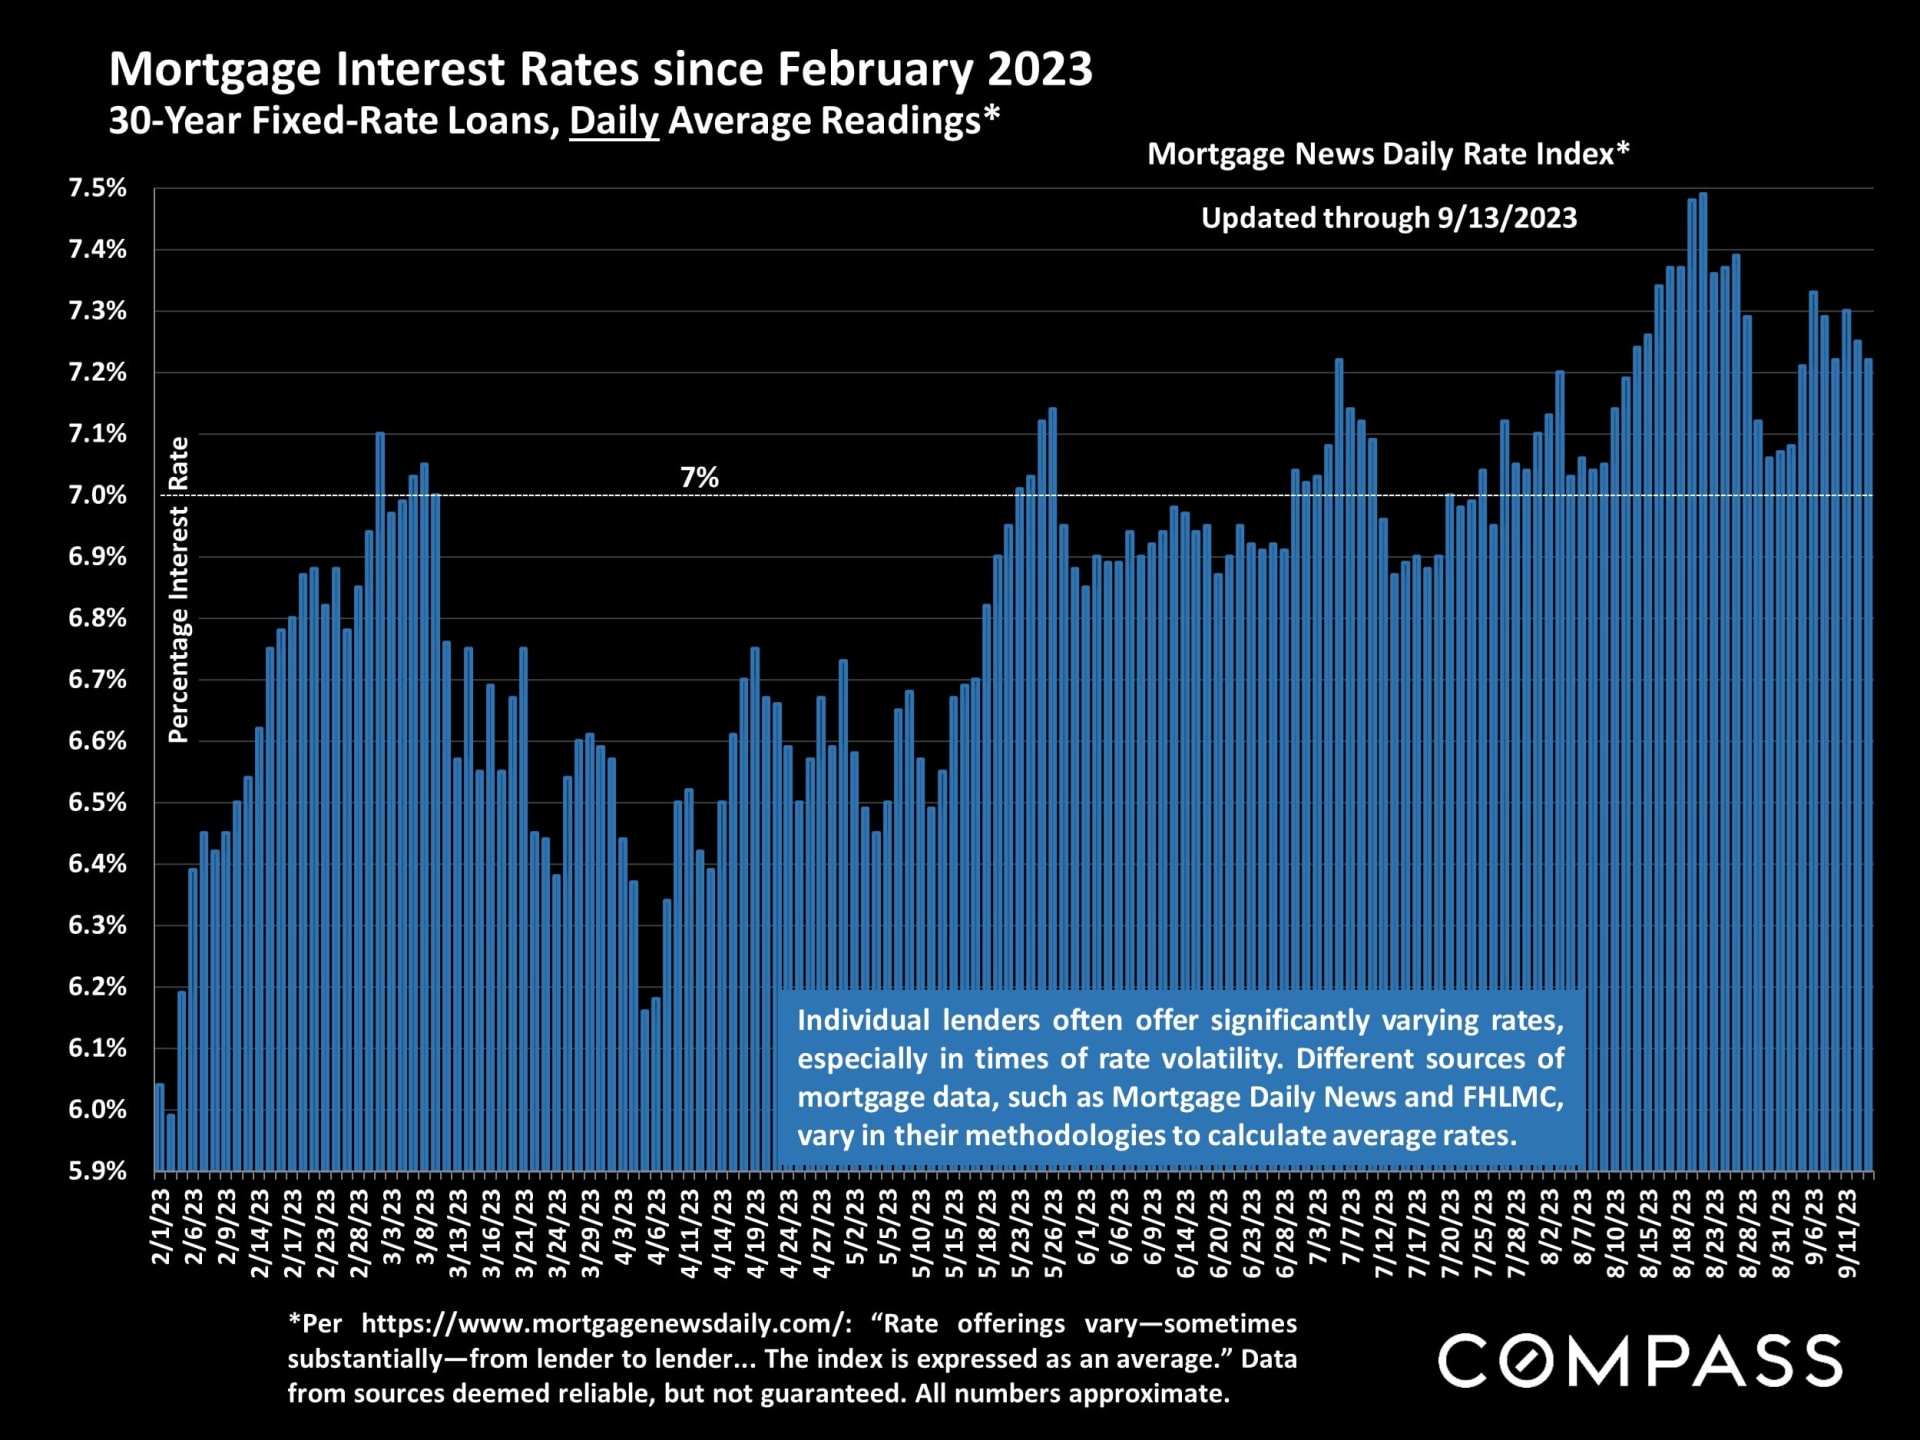
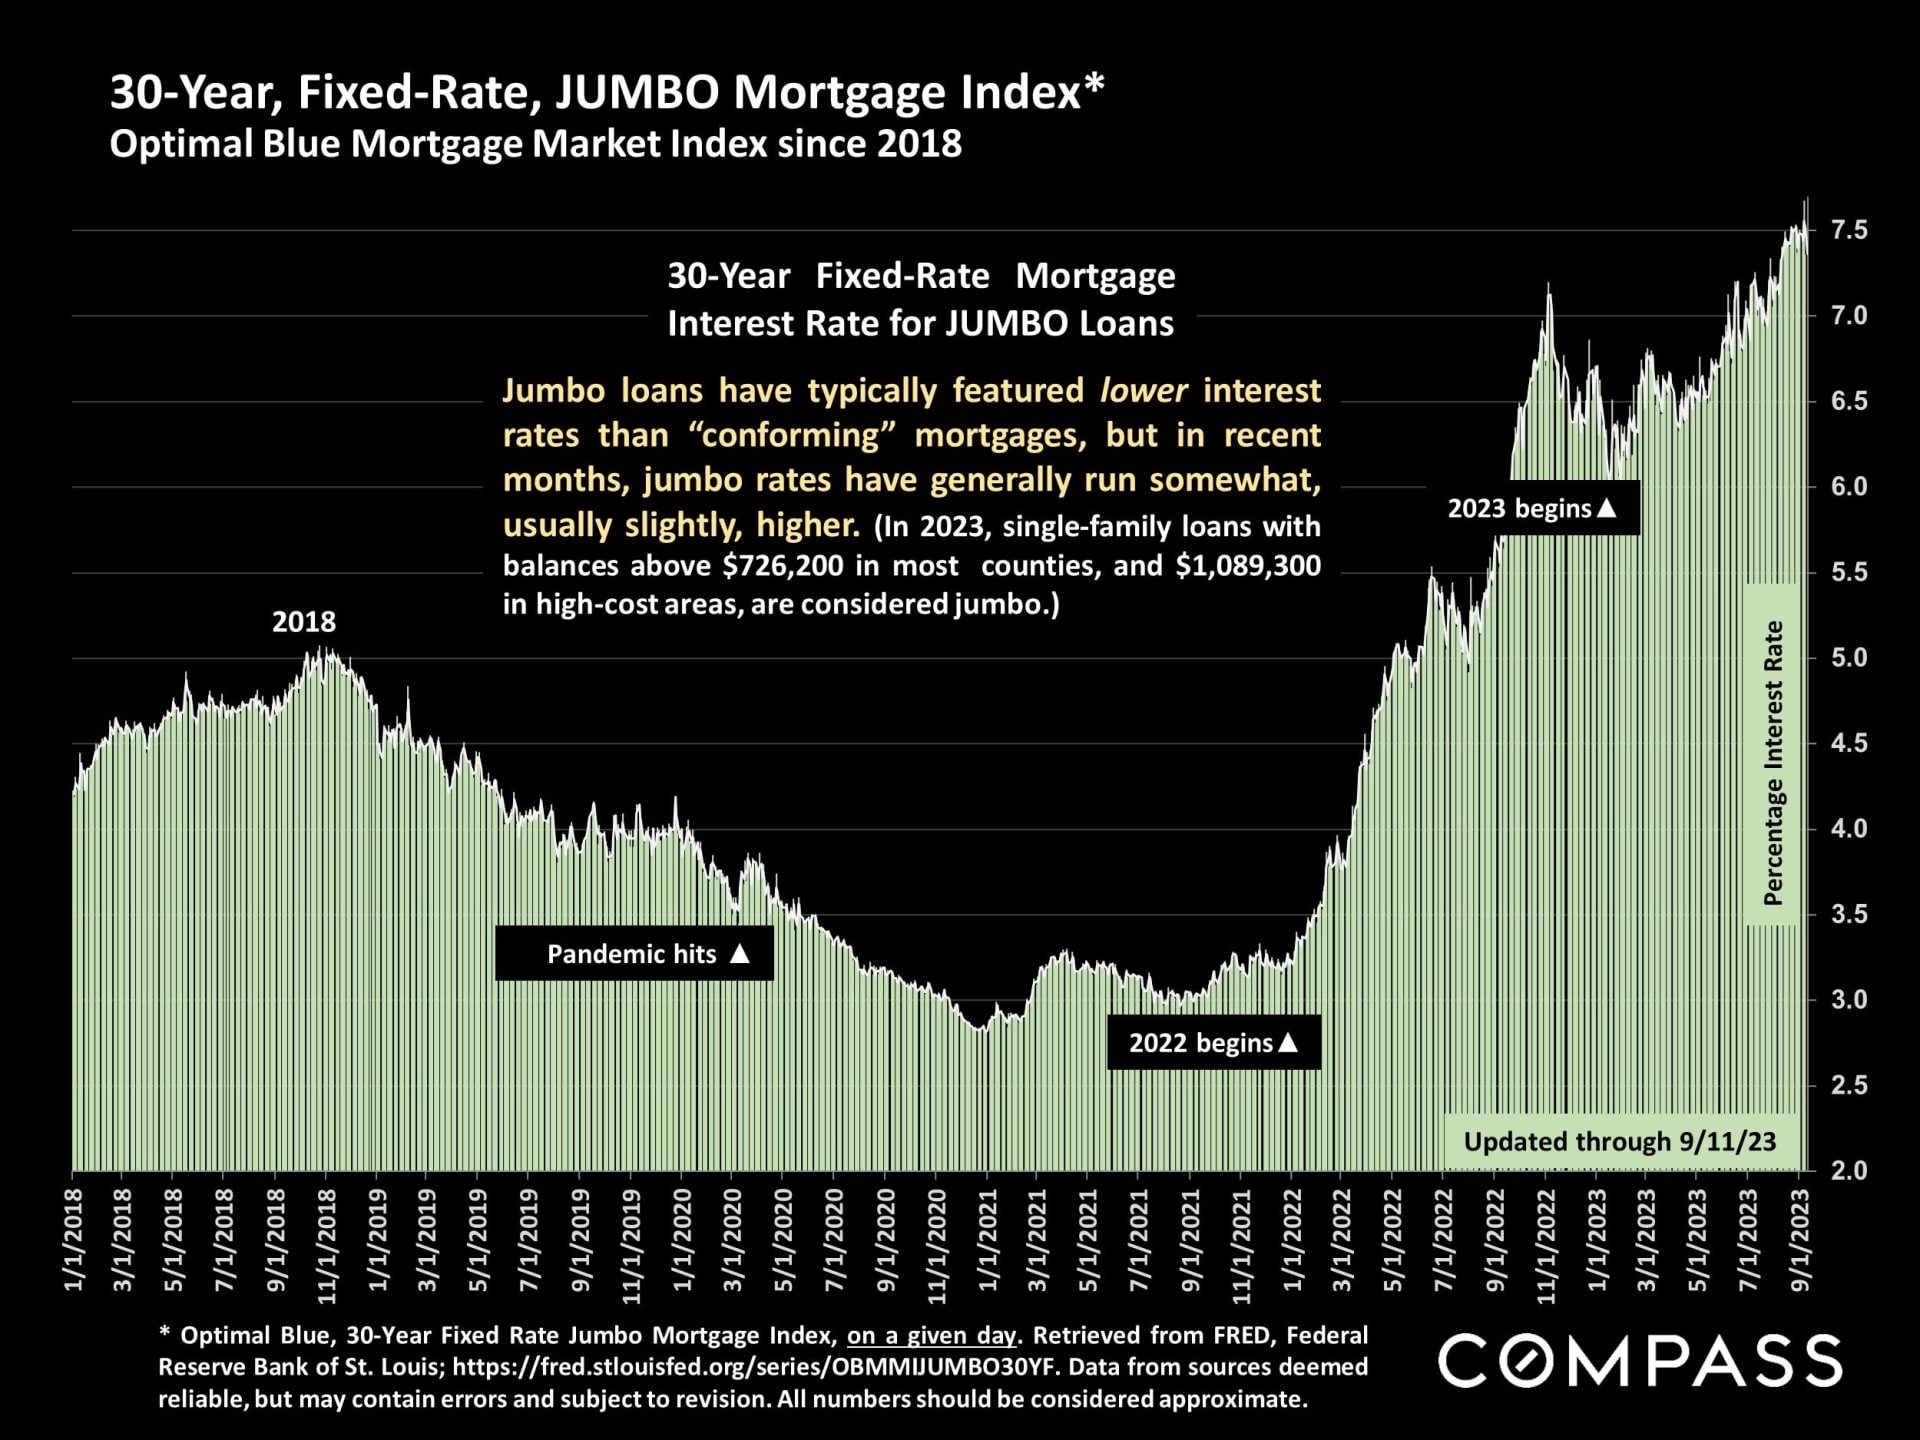
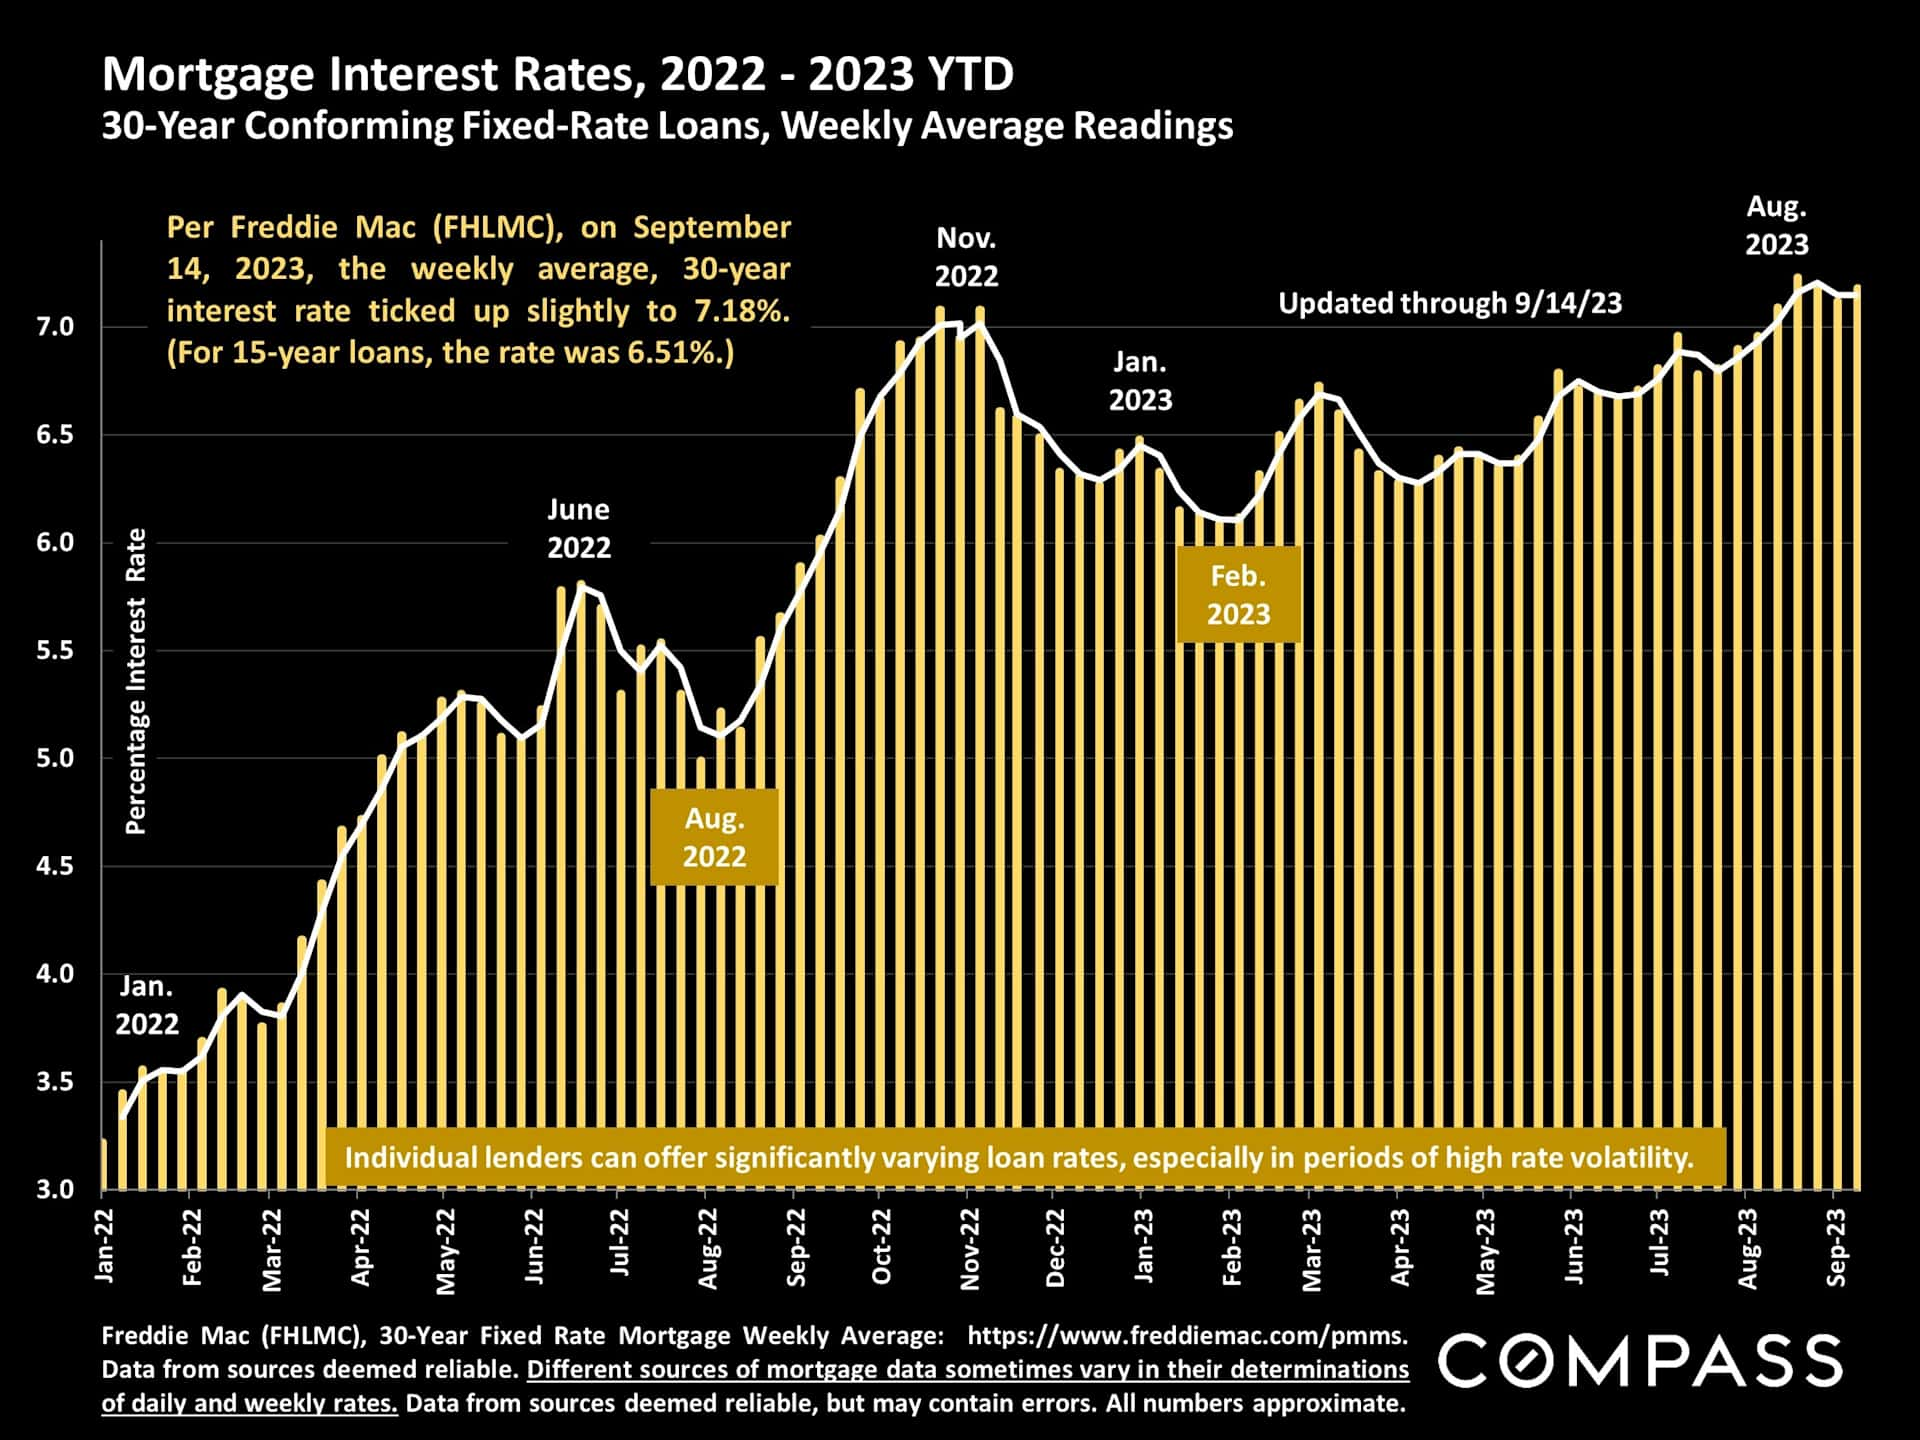
Interest rates: Daily and weekly averages.
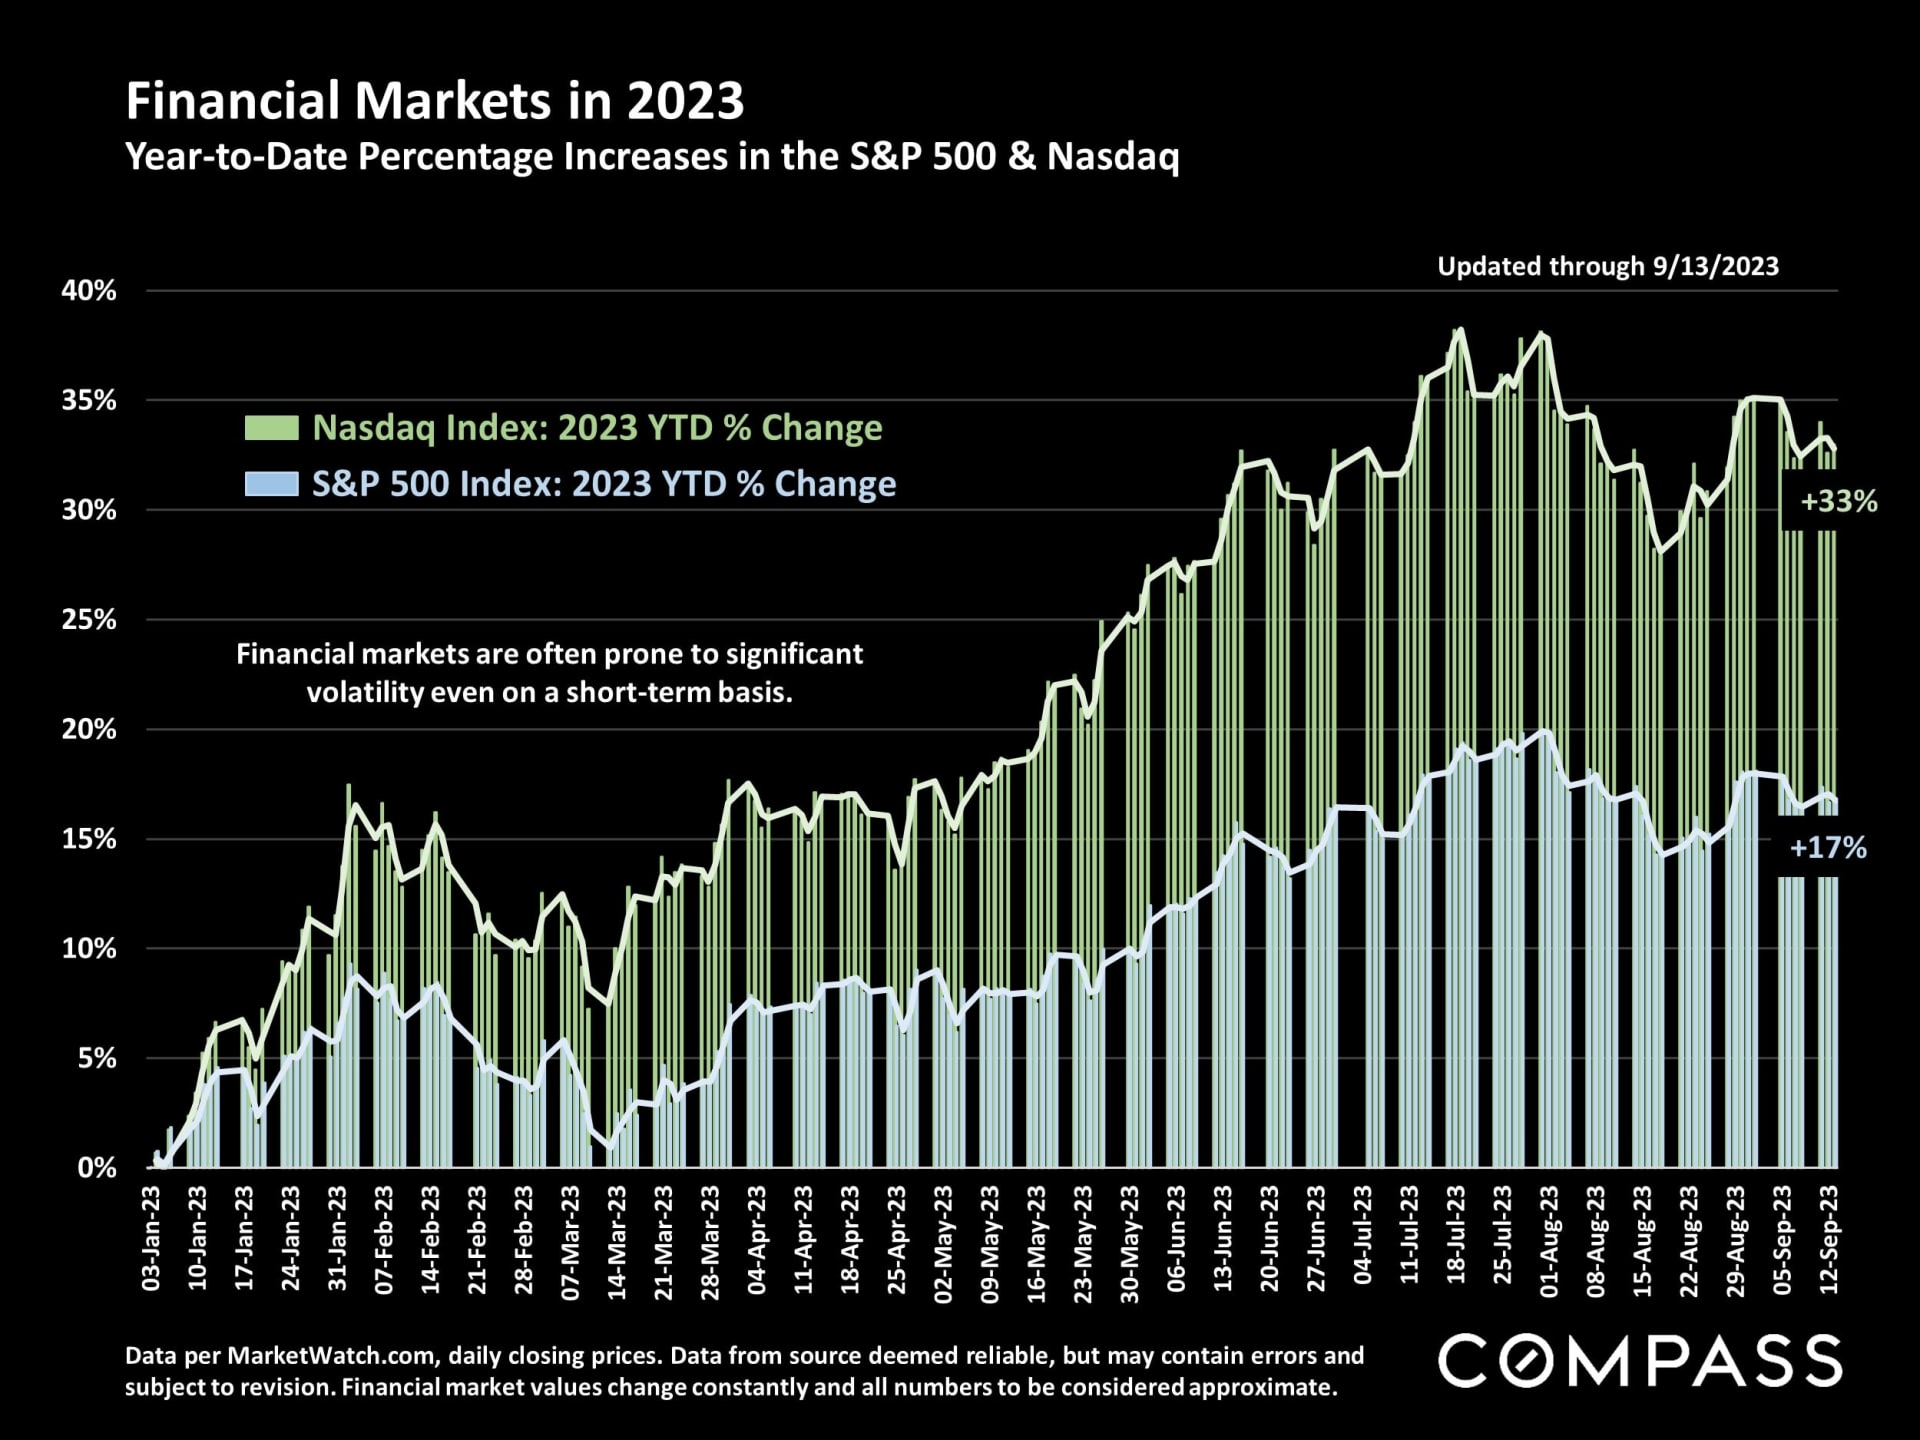
Stock markets:
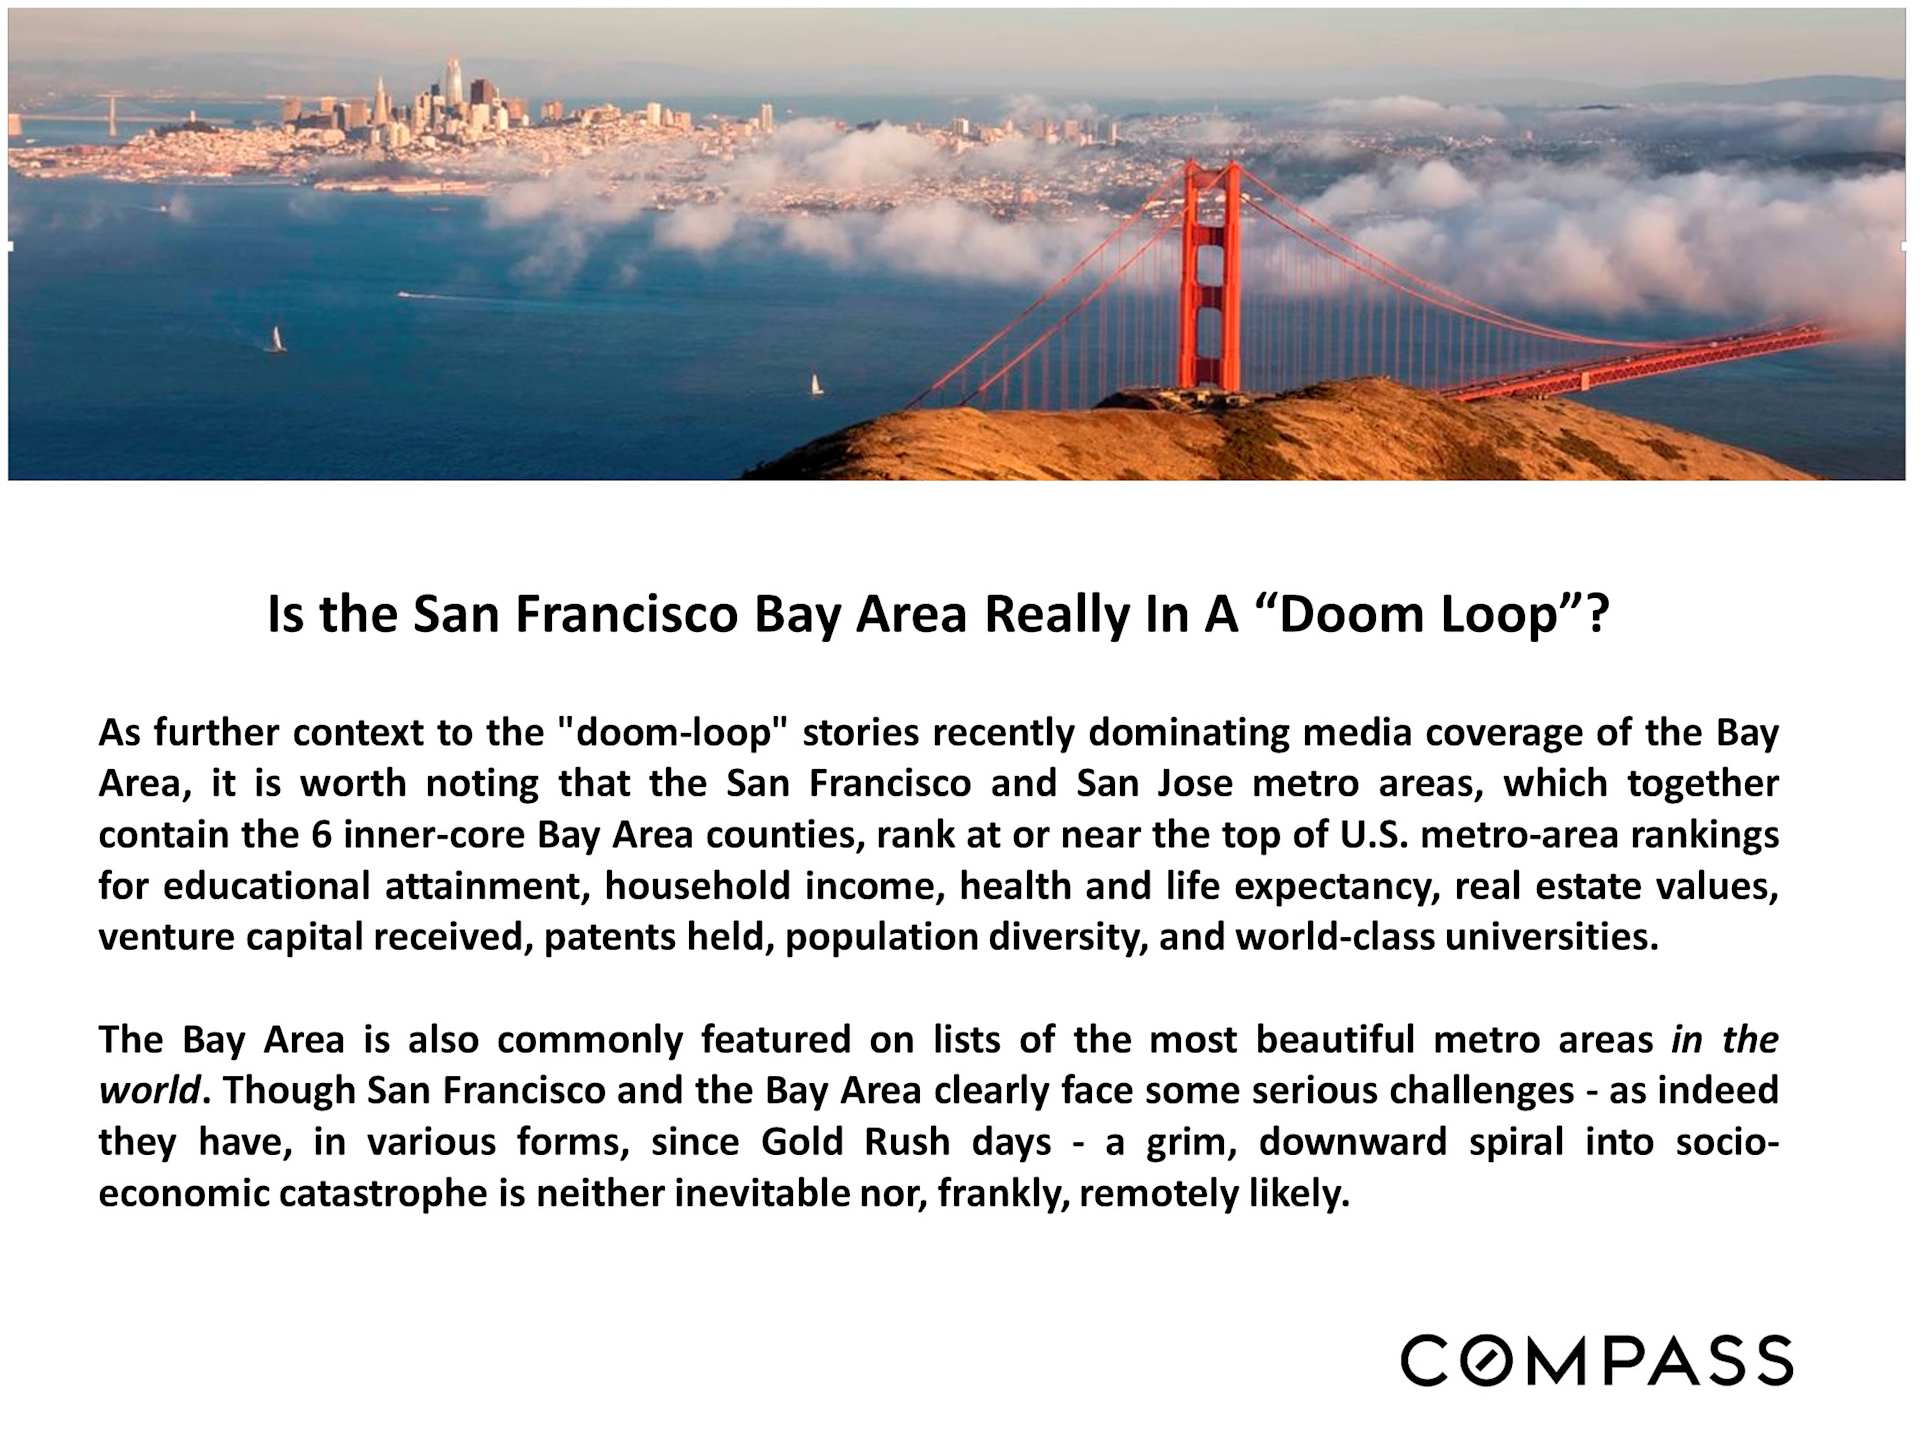
I created a summary slide regarding all the over the top "doom-loop" dominating media coverage in the last couple months, if you find it of any use.
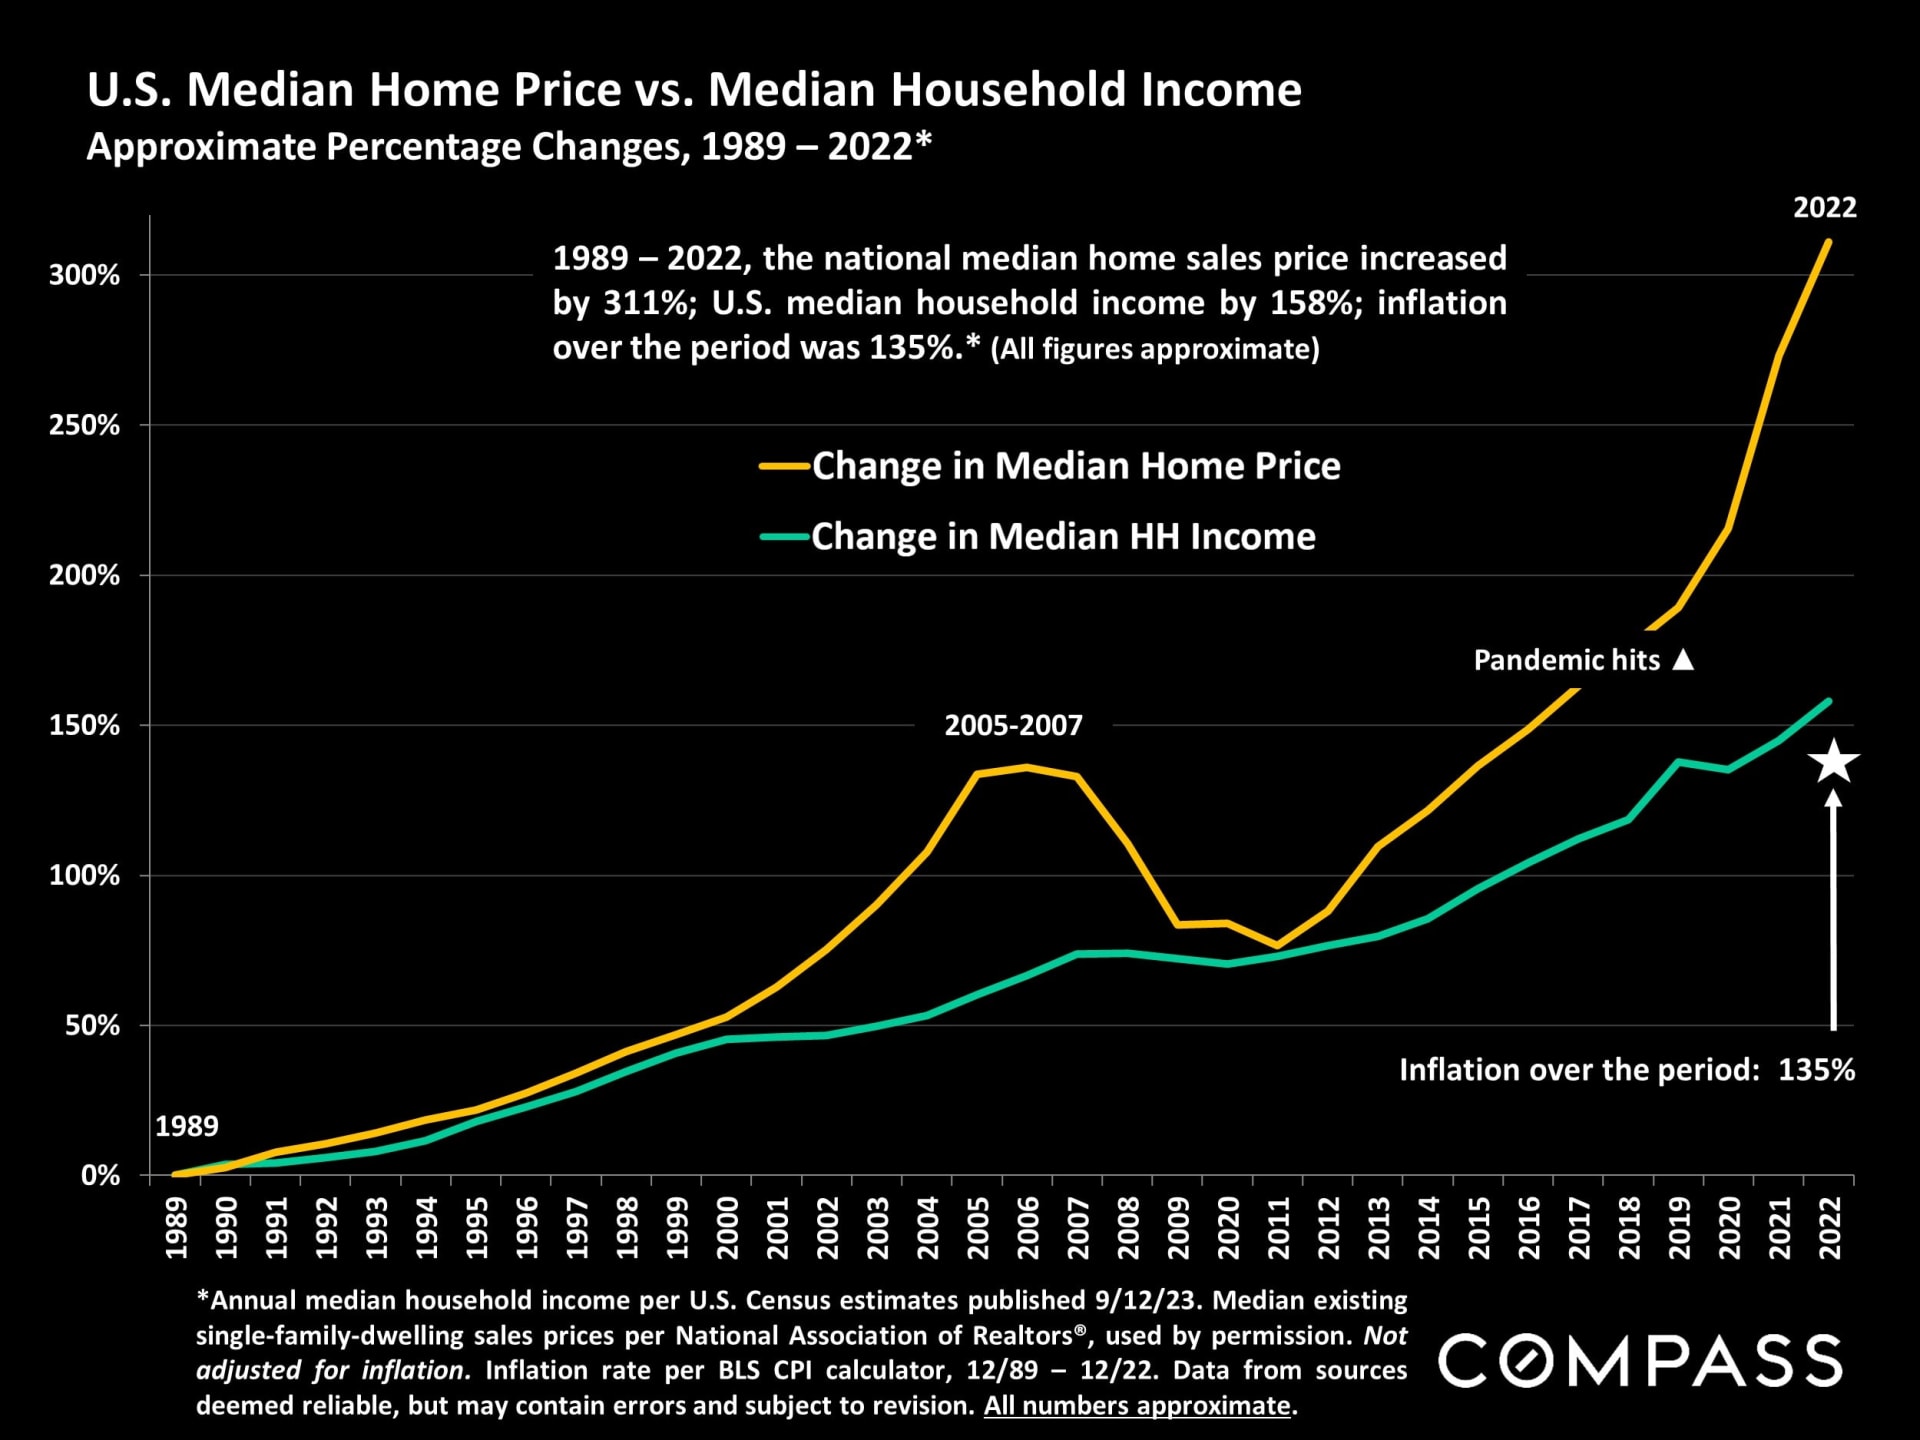
The Census just released national household income figures for 2022 (which ticked down slightly), and I charted the difference in appreciation between U.S. median home prices and U.S. median household income. County 2022 household income figures are supposed to be released very soon, and then I'll chart these dynamics for Bay Area Counties.
Share:
