Economic developments haven't been as positive in February as we had hoped. As illustrated in the first chart below, interest rates have been climbing this month (after the large drop from November). Mortgage application rates have also turned volatile after the positive growth trend at the beginning of the year, dropping in 2 of the past 4 weeks, including the most recent week - though refinance applications have declined further than purchase applications.
This is all very short-term data, which could turn around again in a heartbeat as economic factors remain unsettled.
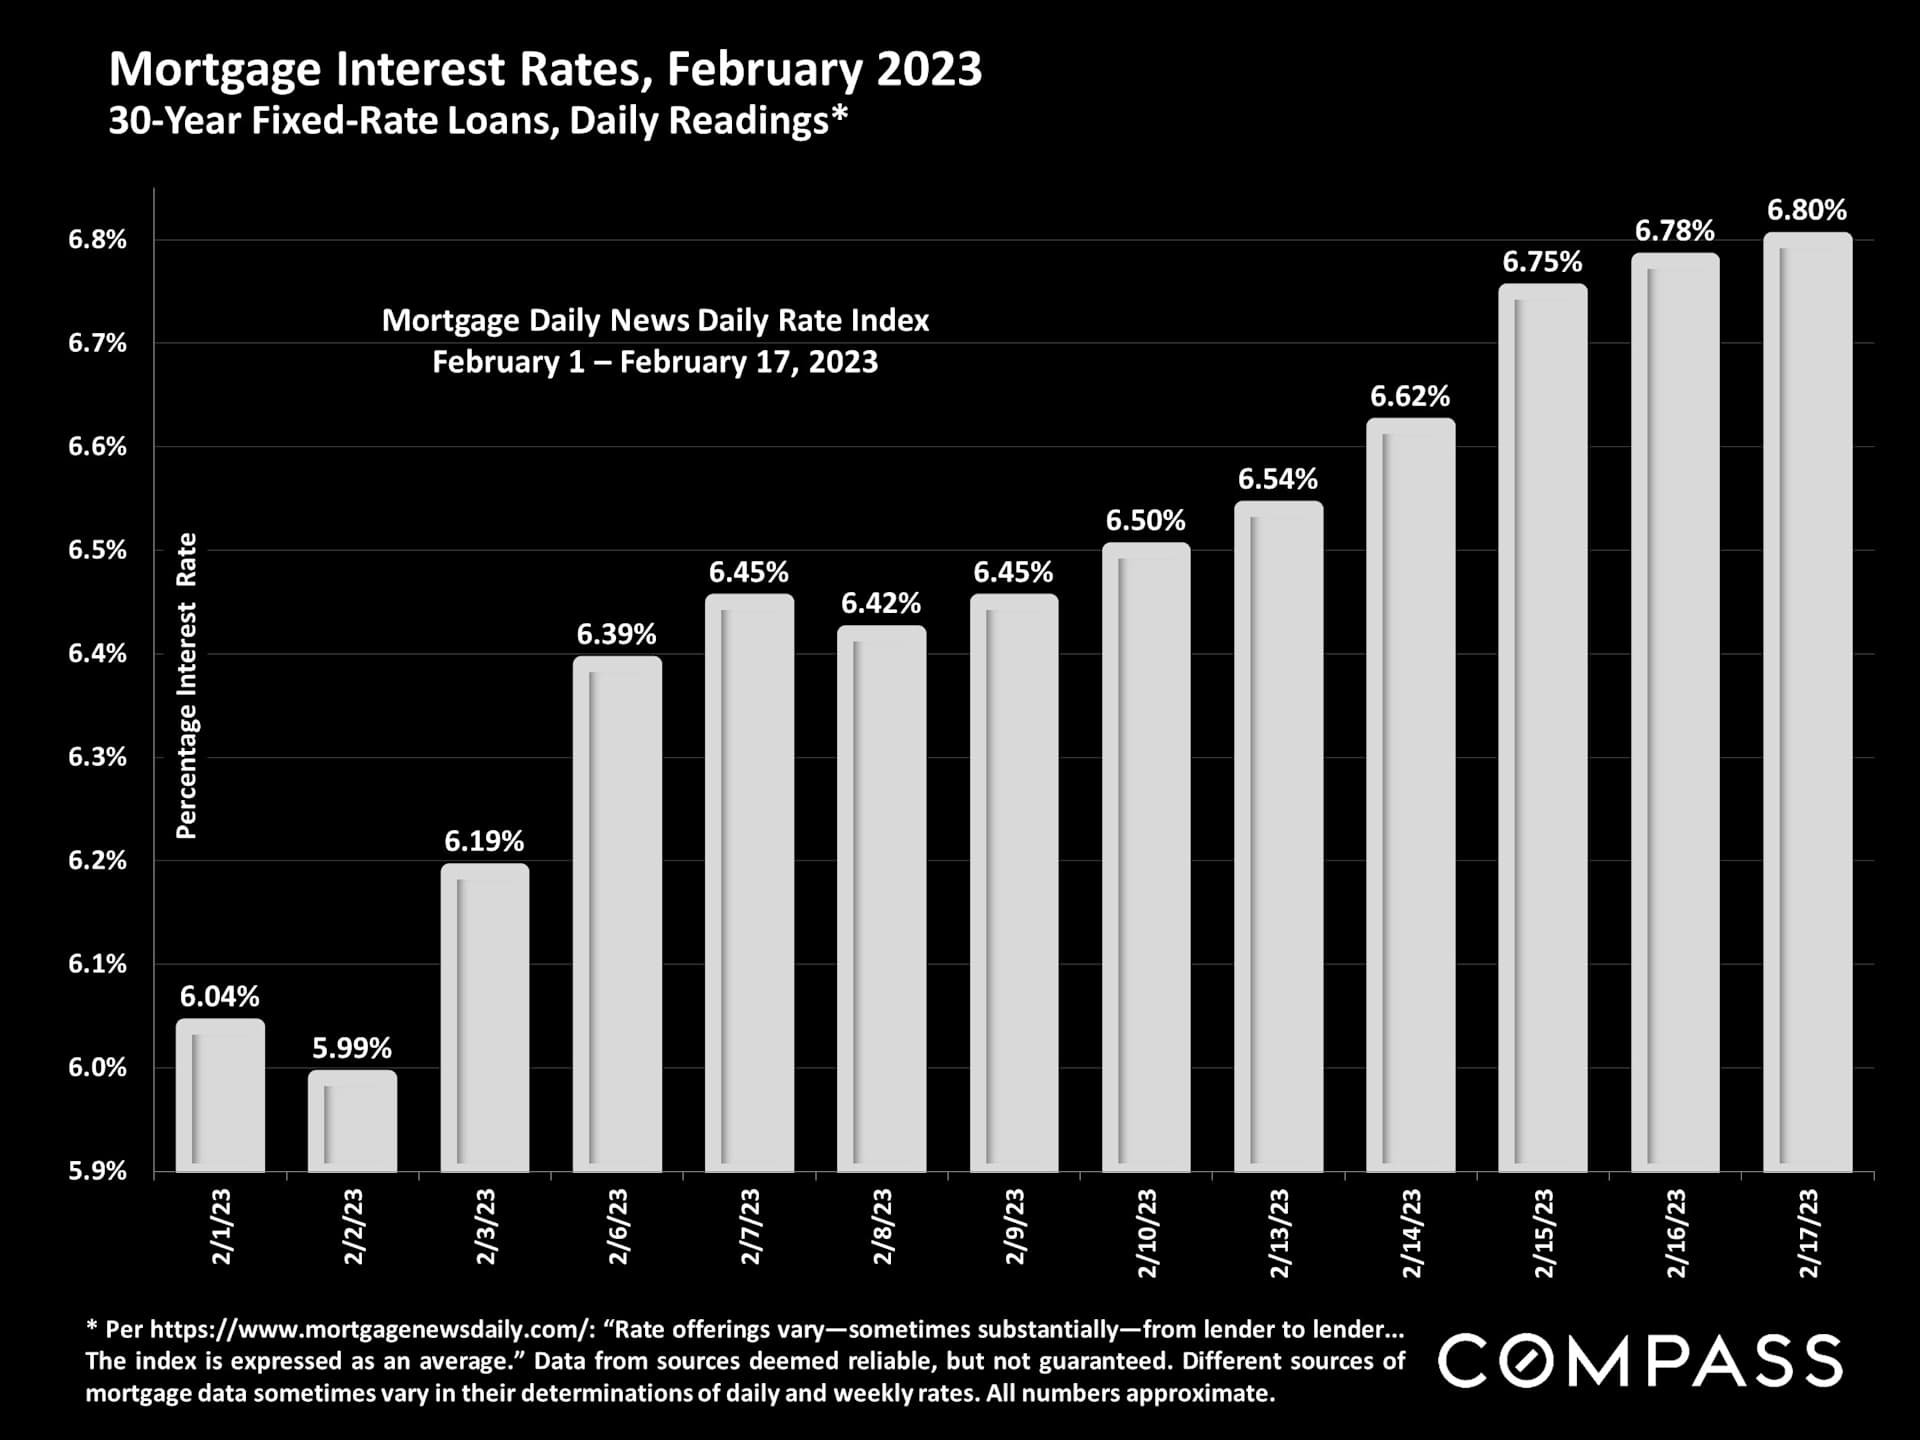
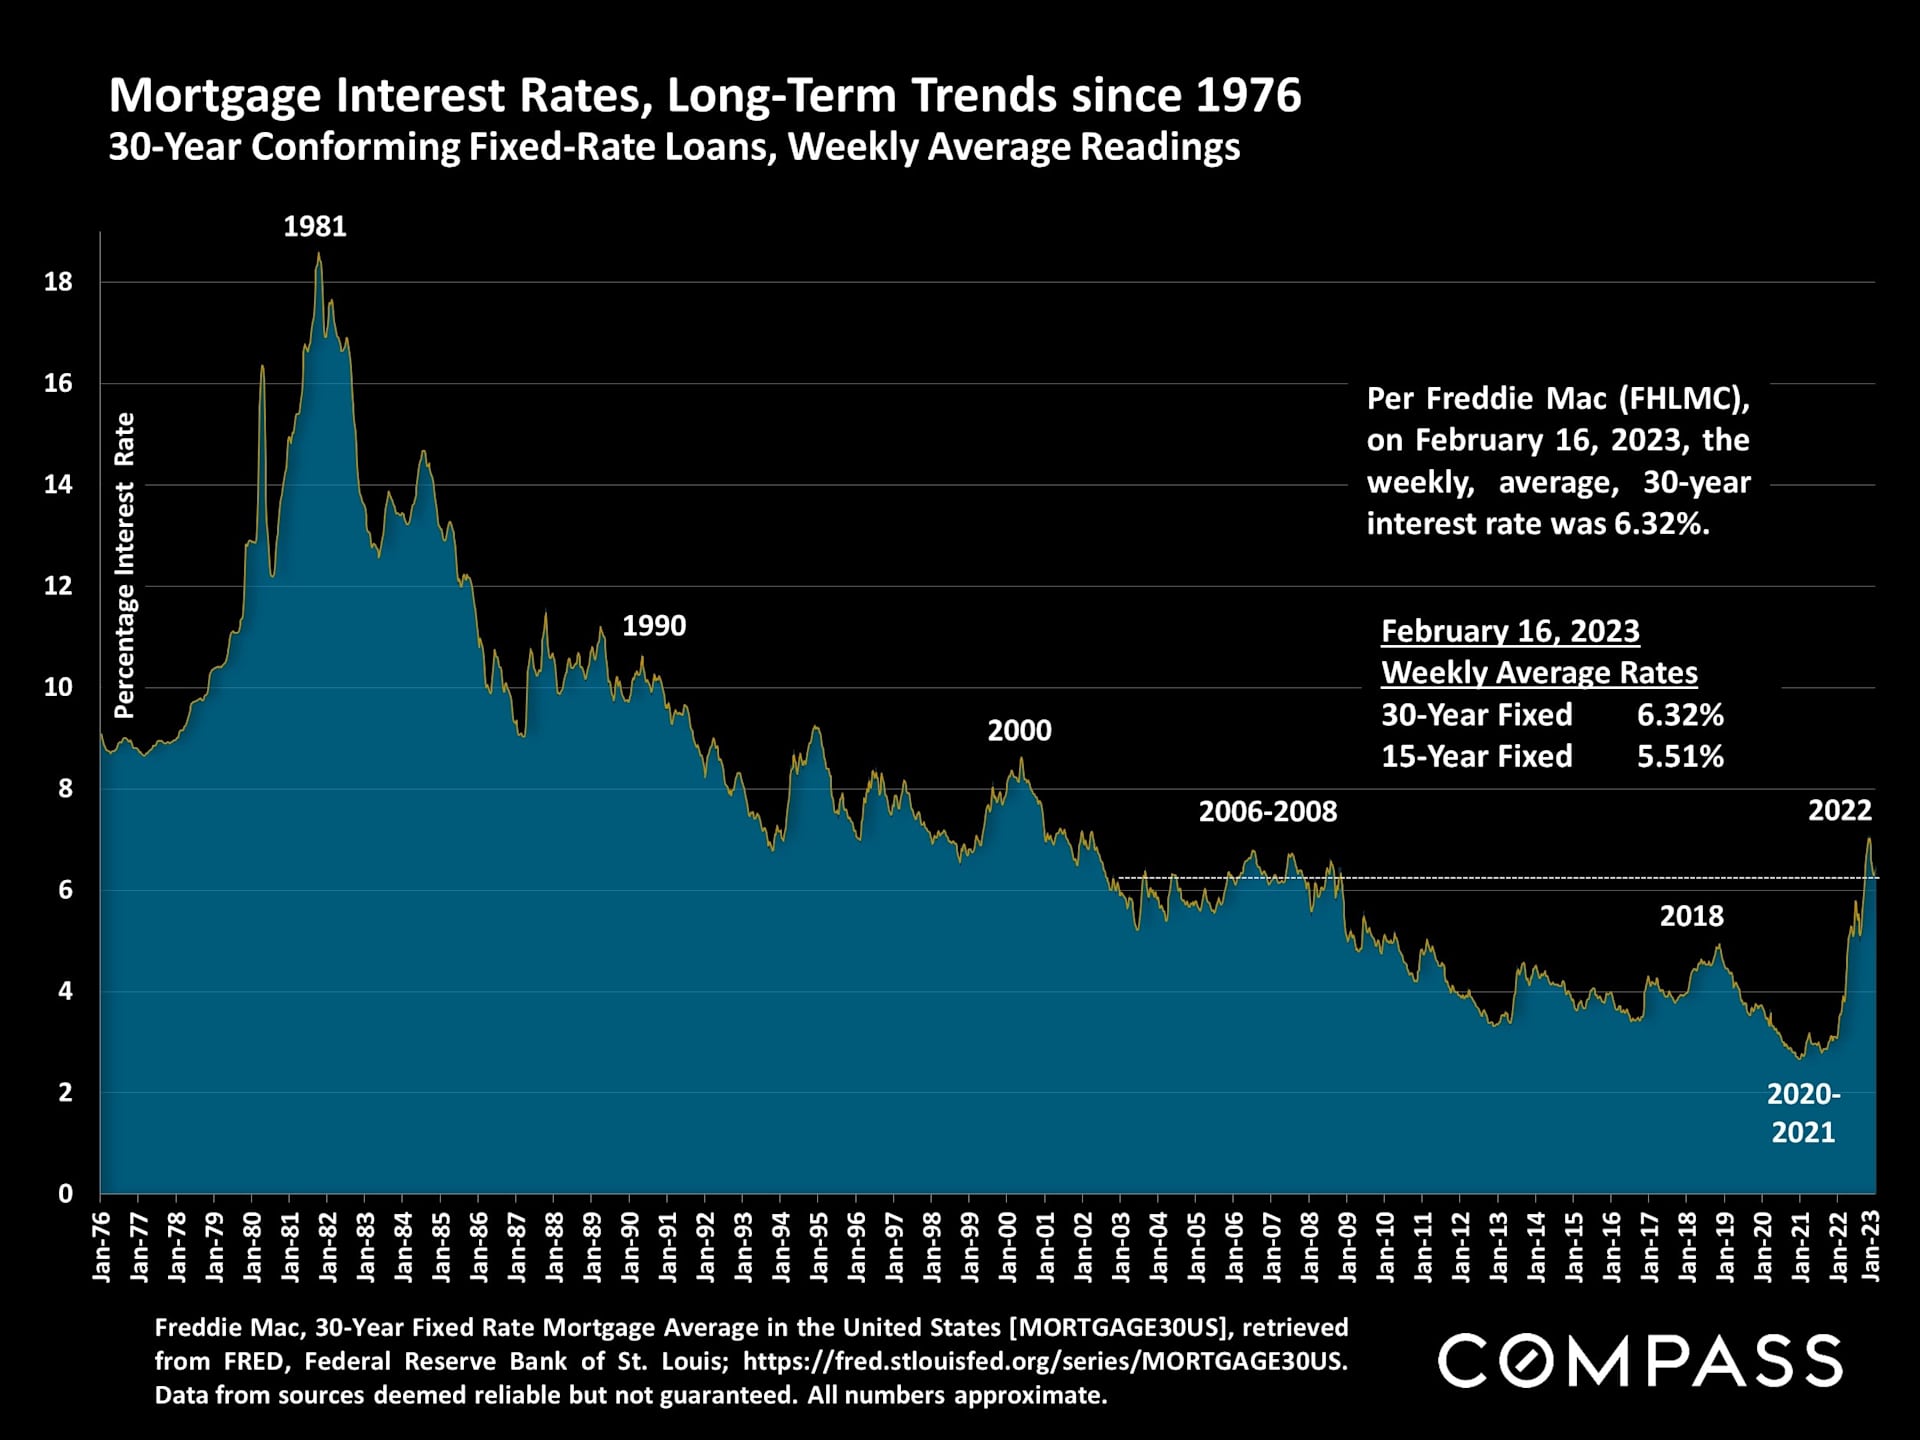
Below is the long-term chart using Freddie Mac's weekly average numbers as reported on the morning of 2/16/23. Weekly average rates are still well behind the daily rates reported by Mortgage Daily news, illustrated above. The next Freddie Mac reading will be on Thursday. Different sources often use different methodologies to calculate their average rates for "30-year fixed rate loans," but trends up or down are typically very similar.
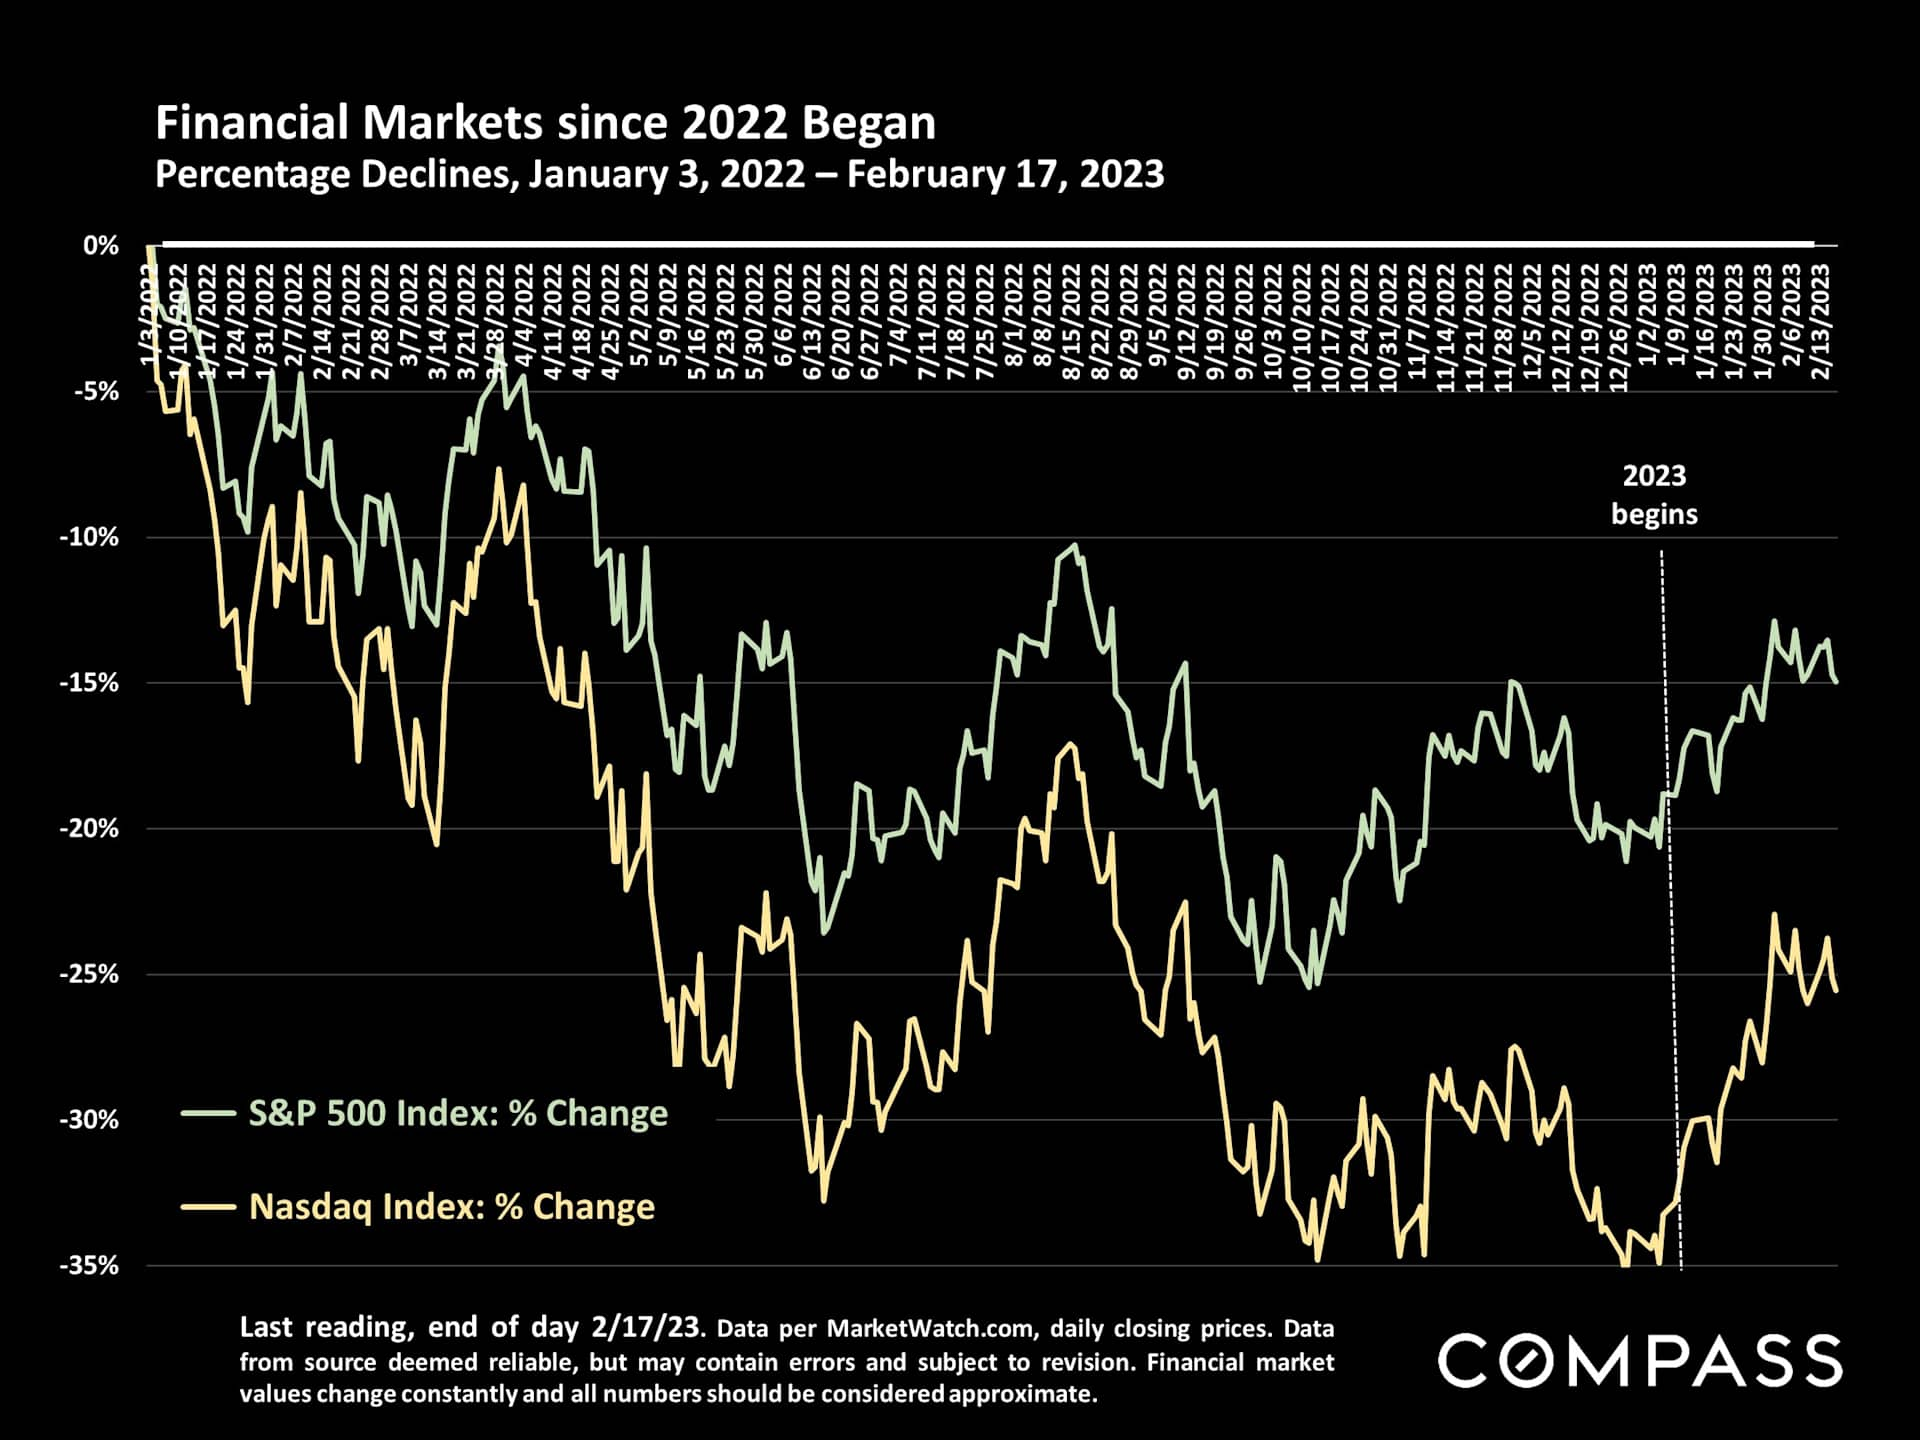
With some volatility, stock markets have fallen in February, but remain well above where they started the year, especially the Nasdaq. Affluent buyers generally seem to be affected more by financial markets than by interest rates, though of course, economic factors are often intertwined.
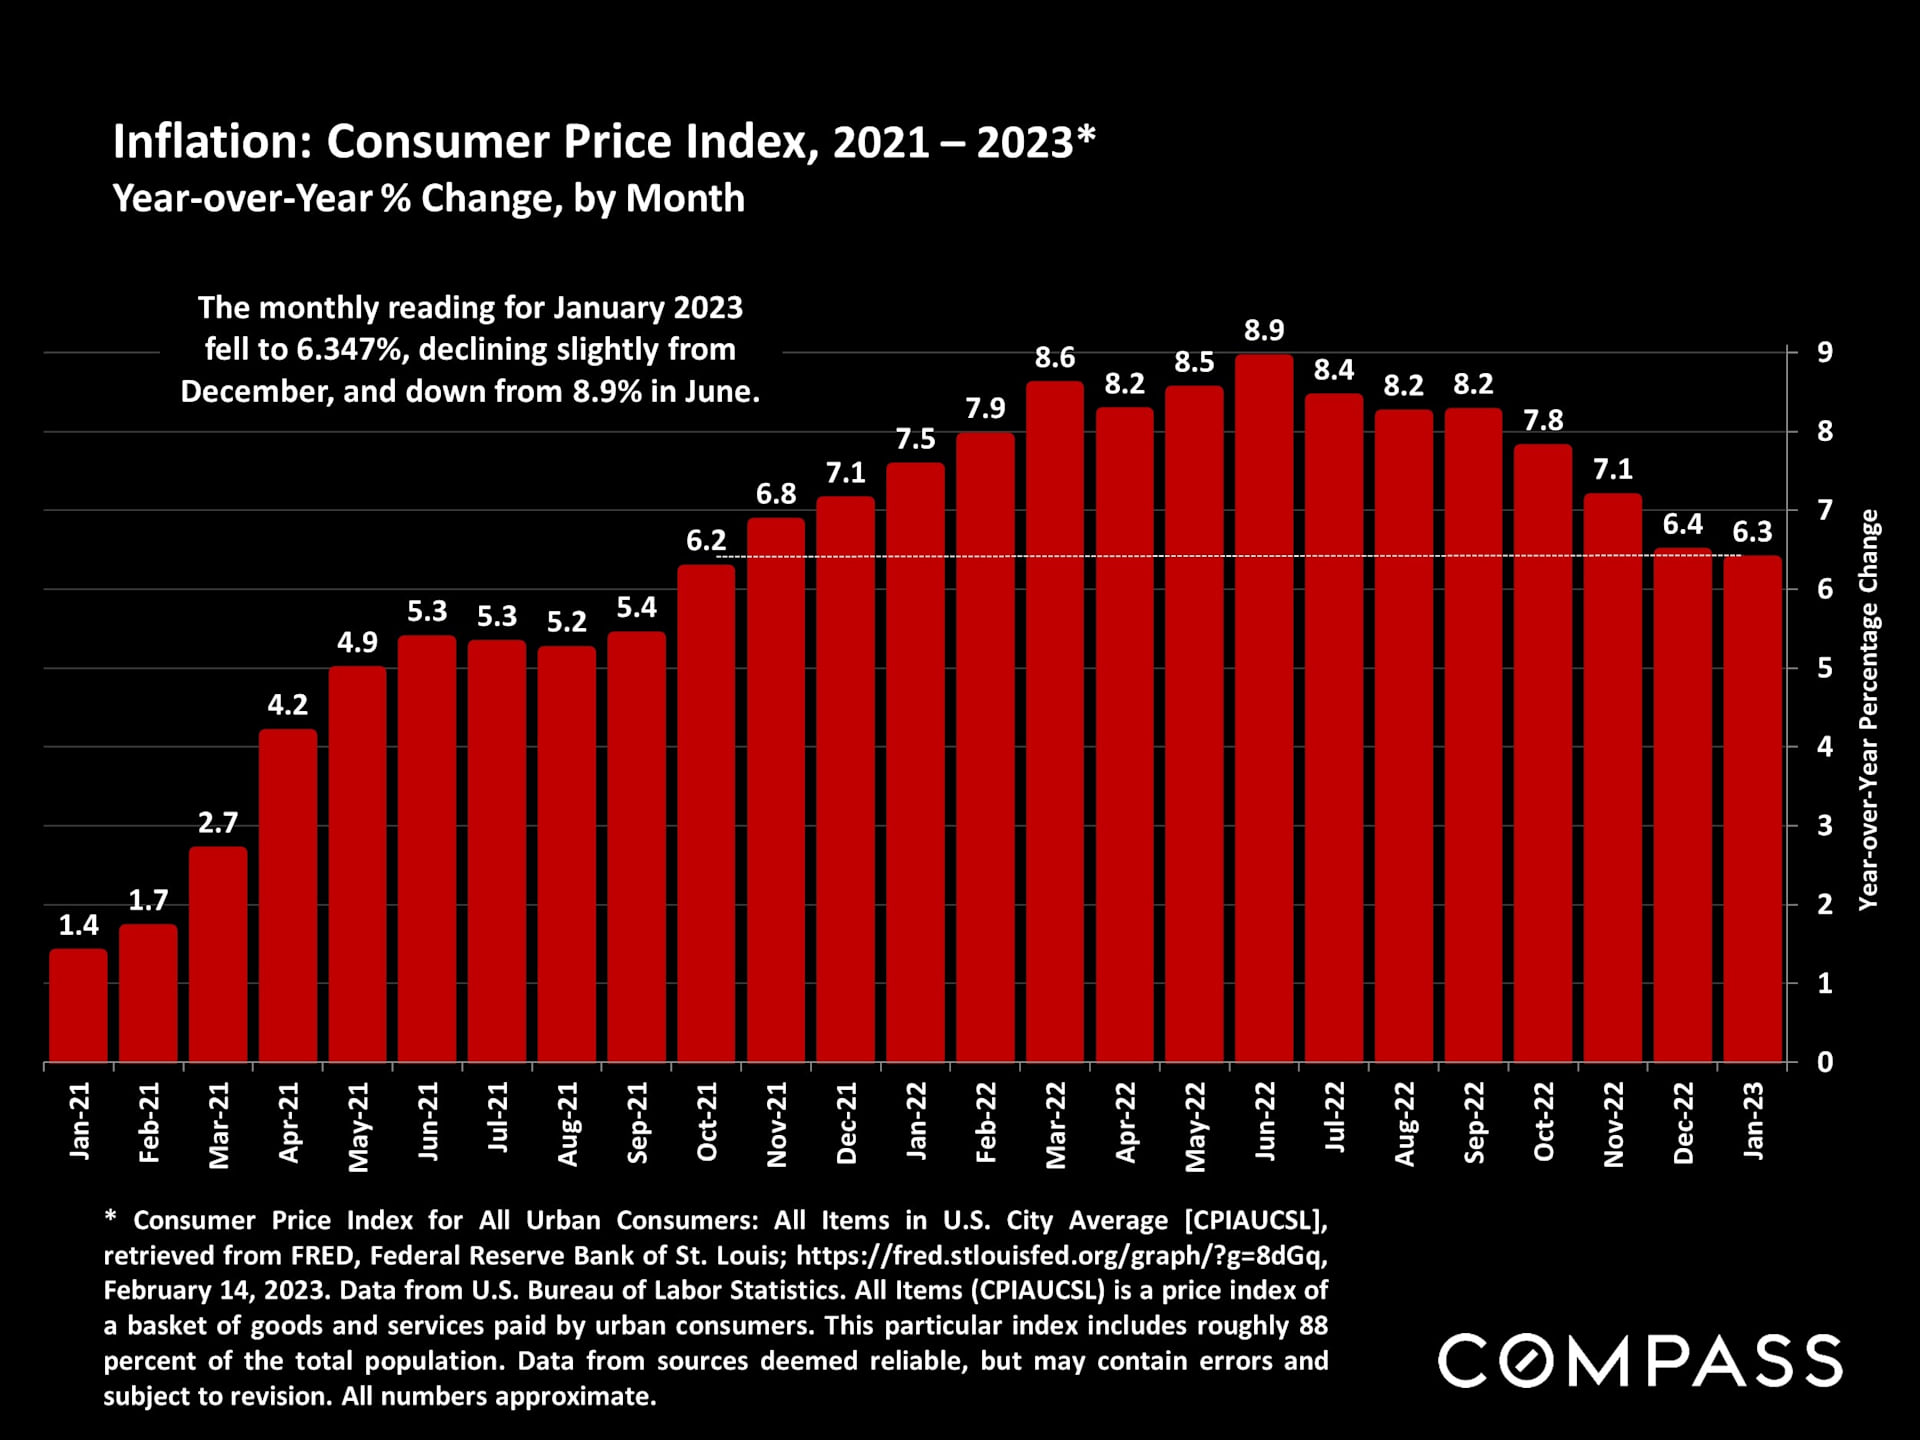
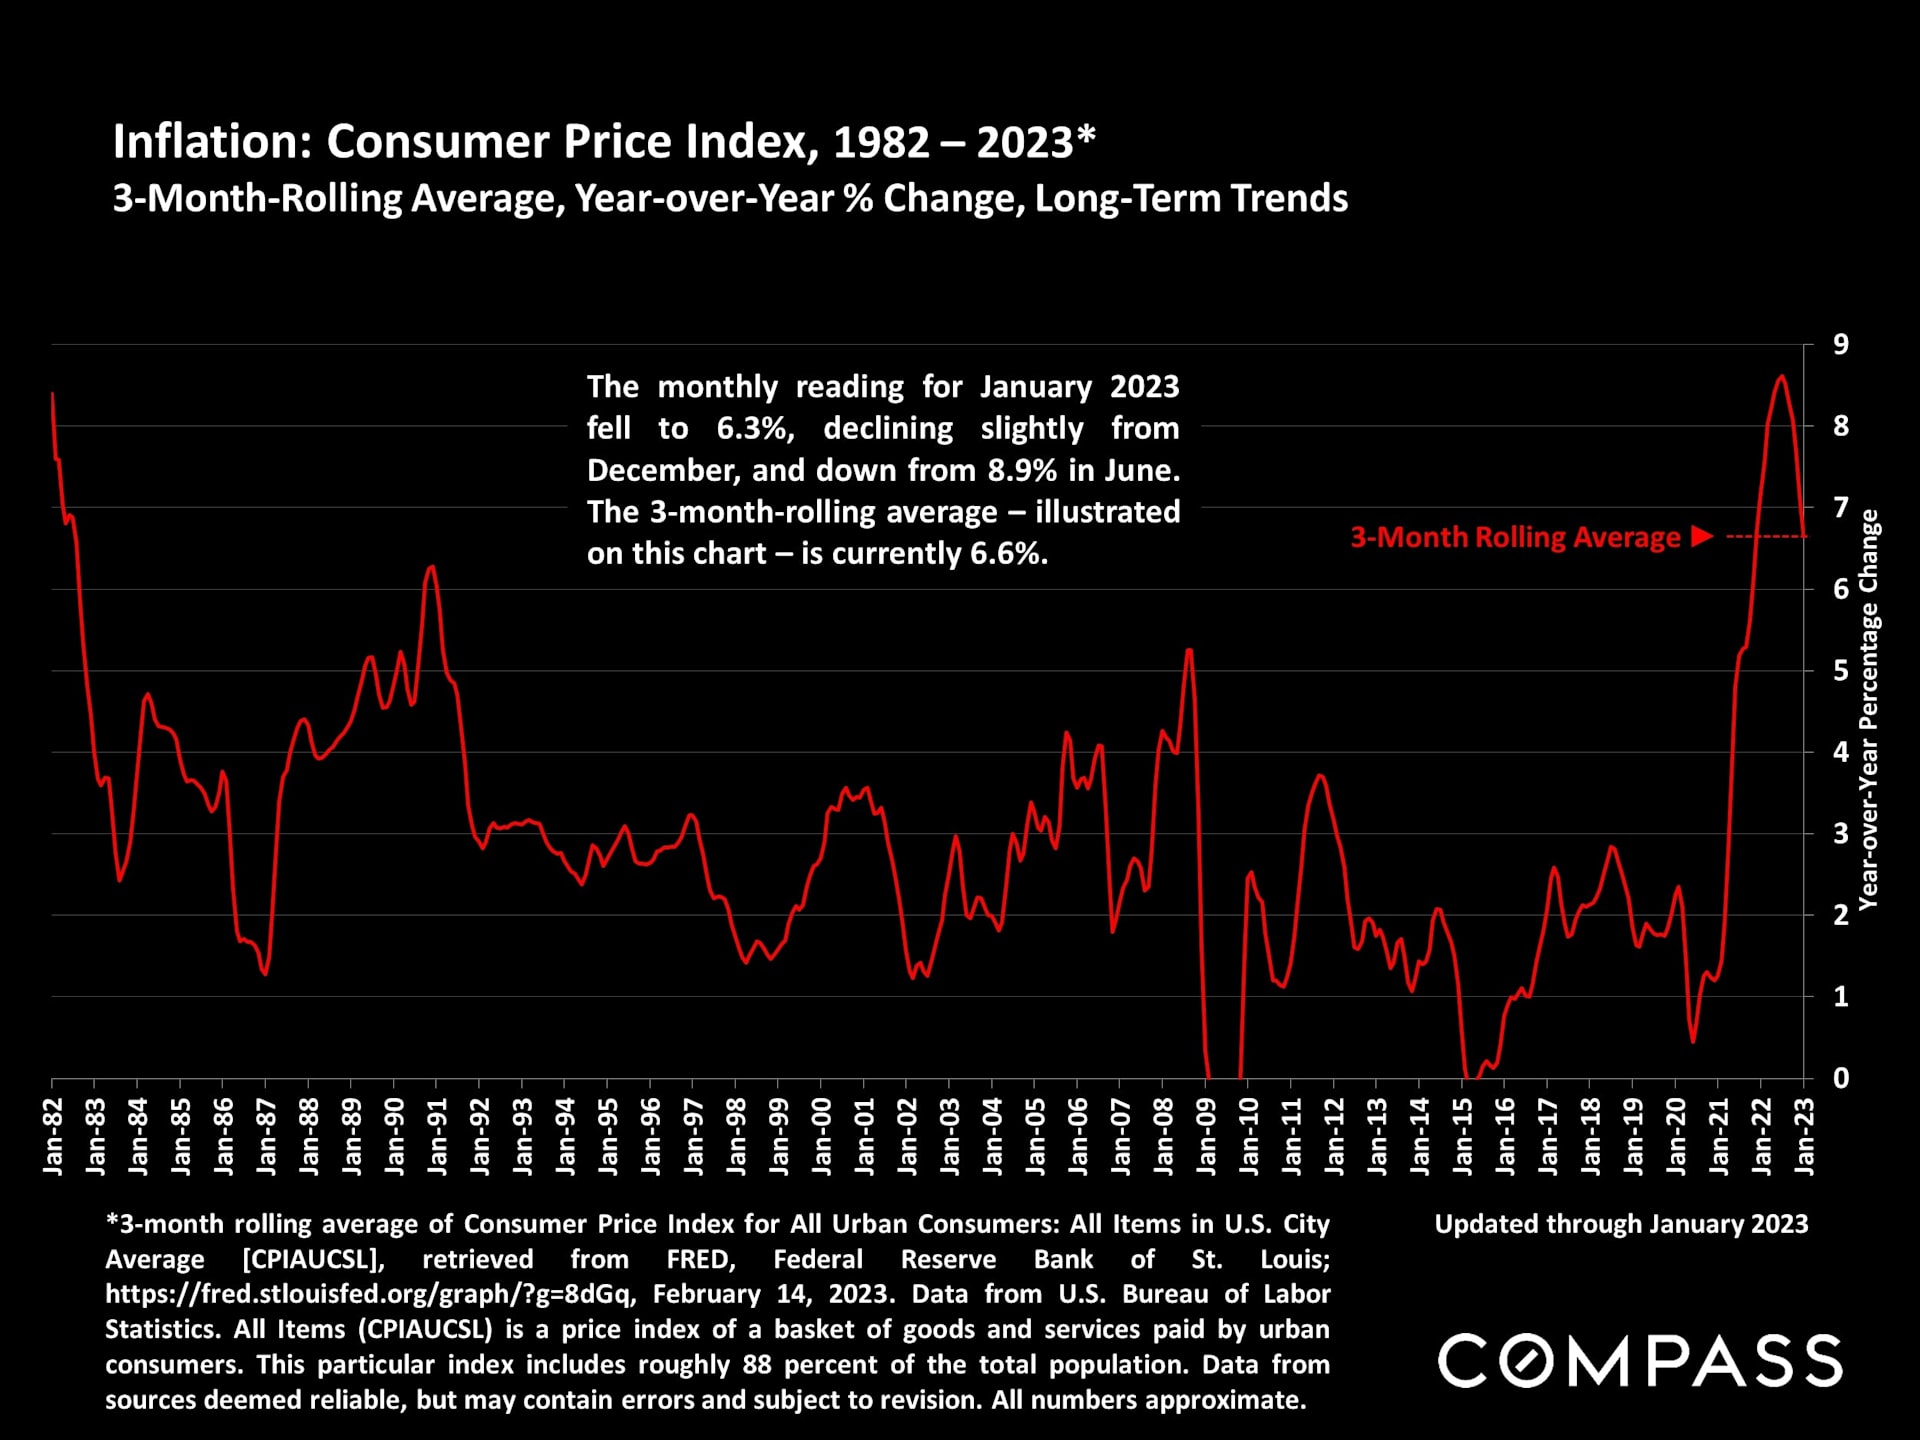
January's inflation index, released last Tuesday, fell only very slightly from December, which spooked the bond market - and to a lesser extent, stock markets - which had hoped for a more substantial decline. The cover of The Economist this week is titled, "Why Inflation Will Be Hard to Bring Down" - they believe investors are over-optimistic, which doesn't mean their analysis is better than others. Opinions vary widely.
Share: